Cargando...
Recursos educativos
-
Nivel educativo
-
Competencias
-
Tipología
-
Idioma
-
Tipo de medio
-
Tipo de actividad
-
Destinatarios
-
Tipo de audiencia
-
Creador
Lo más buscado
- Experimentos P3
- Dibujos para niños de primaria
- Música teatral
- Guía de consumo responsable
- Cleopatra
- Comarques de Catalunya para segundo
- Actividad de lectura para primaria
- Animales dibujados para primero
- Estadística descriptiva
- Invasiones bárbaras
- Aprender a dividir
- Juegos de tablas de multiplicar primero
- Actividades educativas para niños en P2
- Arte bizantino para primero
- Experimentos de botánica para bachillerato
-

The weather
Tiching explorer Organización
- 2873 visitas
In this unit we find out about weather. We discover the equipment we need to collect weather data. We interpret graphs. We read the converstation between some young students from the UK and a real weatherman.
-

Website: ChartGizmo
Tiching explorer Organización
- 1 lo usan
- 1701 visitas
This website provides a tool that allows us to create graphs. We can create a chart from static data or collect information from a web page dynamically. It's free but we need to register.
-

Interpret. Climate charts for Las Palmas and Los Rodeos
EduBook Organización
- 1610 visitas
Look at the two graphs and answer: In which town does it rain more? Which town has the higher average rainfall? Which town has the higher average annual temperature?
-

The Moving Man
Cristina Seco Organización
- 1124 visitas
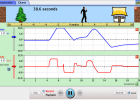
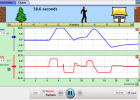
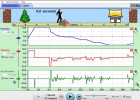
Learn about position, velocity, and acceleration graphs. Move the little man back and forth with the mouse and plot his motion. Set the position, velocity, or acceleration and let the simulation move…
-

The Moving Man
V&V Books Vicens Vives Organización
- 837 visitas
Learn about position, velocity, and acceleration graphs. Move the little man back and forth with the mouse and plot his motion. Set the position, velocity, or acceleration and let the simulation move…
-

The Moving Man
Tiching explorer Organización
- 5508 visitas
With this simulation students will learn about position, velocity and acceleration graphs. They can move the little man back and forth with the mouse and plot his motion. If we set the position,…
-

Graphing with Google Docs and Forms
Tiching explorer Organización
- 1 lo usan
- 4118 visitas
Lesson designed to help students understand a class survey and how to read and interpret different kinds of graphs. Students complete a Google Form that the teacher posts on the web. They analyze data…
-

Before you start - The Earth's climate zones
EduBook Organización
- 2353 visitas
Didactic objectives Identify the different landscapes of the Earth, Europe and Spain’s climate zones, and their geographical location. Describe the characteristics of the Earth and Europe’s…
-

Website: ChartTool
Tiching explorer Organización
- 1 lo usan
- 2379 visitas
Website that provides a tool that allows us to create and share our charts and graphs. We can choose from 10 chart types, choose charts style, add data, customize labels and fonts, and save it and share…
-

European Election Database (EED)
V&V Books Vicens Vives Organización
- 1097 visitas
The European Election Database is a resource for comparative research on elections in Europe, coveringparliamentary elections, presidentials elections, European Parliament elections and EU-related…
Te estamos redirigiendo a la ficha del libro...


