Cargando...
Recursos educativos
-
Nivel educativo
-
Competencias
-
Tipología
-
Idioma
-
Tipo de medio
-
Tipo de actividad
-
Destinatarios
-
Tipo de audiencia
-
Creador
Lo más buscado
- Relieve de Australia
- Actividades de geometría en cuarto
- Guerra de Irak
- Rios de Oceania
- Repaso de lengua castellana para tercero
- Cuentos para dormir
- Eras geológicas
- Mickey Mouse
- Aprender a educar
- Letras L
- Lecturas comprensivas para imprimir
- Experimentos de matemáticas educación infantil
- Los demostrativos
- Miguel de Cervantes
- Comarques de Catalunya para sexto
-

Analyse. The Ford cars
EduBook Organización
- 3079 visitas
Look at the table and answer the questions: Analyse the data and relate the increased production with price developments. How are cheaper production costs reflected?
-

Solar System
Tiching explorer Organización
- 8 lo usan
- 4043 visitas
Activity designed to help us learn about the planets of the Solar System. The resource contains data, general information and number of moons of each planet.
-
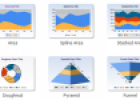
Website: DIY chart builder
Tiching explorer Organización
- 1 lo usan
- 3299 visitas
DIYchart is a web-based tool that allows us to create interactive charts and graphs from static or dynamic data. It's free but we need to register first.
-
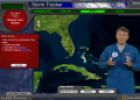
Game: Storm tracker
Tiching explorer Organización
- 1 lo usan
- 3206 visitas
In this interactive activity we learn how to analyze satellite maps and weather data in order to make daily storm track and intensity predictions.
-

Tria la resposta. Cronologia de la civilització grega
EduBook Organización
- 2483 visitas
Indica quina data correspon a cada fet: arribada dels doris batalla de Marató colonitzacions al Mediterrani Alexandre el Gran democràcia atenesa reformes de Soló a Atenes
-

Elixe. Cronoloxía da civilización grega
EduBook Organización
- 2404 visitas
Indica que data corresponde a cada feito: chegada dos dorios batalla de Maratón colonizacións no Mediterráneo Alexandre Magno democracia ateniense reformas de Solón en Atenas
-
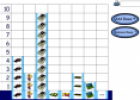
My favourite toy
TESiboard Organización
- 3776 visitas
With this online tool we can see what are our favourite toys. We complete the pictogram and print it. We interpret graph and data.
-
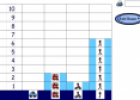
How I get to school
TESiboard Organización
- 3074 visitas
With this online tool we can see what are our ways of travelling to school. We complete the pictogram and print it. We interpret graph and data.
-

Global Climate Change
V&V Books Vicens Vives Organización
- 2 lo usan
- 1776 visitas
Vital Signs of the Planet: Global Climate Change and Global Warming. Current news and data streams about global warming and climate change from NASA.
-
Webquest: All about bears
Tiching explorer Organización
- 2733 visitas
Resource designed to help us study bears (types, diet, abilities, population, etc). We complete the missing data in a worksheet, and finally we draw a picture.
Te estamos redirigiendo a la ficha del libro...


