Cargando...
Recursos educativos
-
Nivel educativo
-
Competencias
-
Tipología
-
Idioma
-
Tipo de medio
-
Tipo de actividad
-
Destinatarios
-
Tipo de audiencia
-
Creador
Lo más buscado
- Distibución de la población
- Experimentos de ciencias para primero
- Chimpancés
- Atapuerca
- Actividades de lógica en sexto
- Experimentos P4
- Huesos del cuerpo humano primaria
- Actividades ortografia imprimir
- Repaso de fracciones ESO
- Actividades económicas
- Júpiter
- Salvador Allende
- Rinoceronte
- actividades matemáticas
- Actividades educativas para niños en P3
-

Look and answer. Absolutism and Liberalism
EduBook Organización
- 1568 visitas
Look at the graph and answer the questions: What are the characteristics of an absolute monarchy? Who has the power in an absolutist government? And in a liberal government? What is a constitution?
-

Read a population pyramid - The Earth's Population
EduBook Organización
- 4455 visitas
A population pyramid is a graph that shows the structure of a population by age and gender. A population pyramid includes the following elements: Age groups. Each age group covers five years, beginning…
-

Interpret. Life expectancy
EduBook Organización
- 2749 visitas
Look at the graph and answer the questions: How did the life expectancy of Spaniards change between 1975 and 2010? What does this change tell us about the level of well-being? Who has a higher life…
-

Interpret. Media audiences
EduBook Organización
- 2206 visitas
Look at the graph and answer the questions: Which types of media do people in Spain use most? Which ones are used by fewer than 30% of the population? Can you explain why? How many different media forms…
-

Final Autoevaluation 1.02 - Plant nutrition
EduBook Organización
- 1974 visitas
Graph a shows how the size of the pores in the stomata changes when a plant is exposed to light. Describe the changes: ➞ At... o'clock the pores measure... By... o'clock they... bigger/smaller…
-

Learn. Making a timeline
EduBook Organización
- 1704 visitas
What do we need? Graph paper Coloured pencils What do we do? A timeline shows the order in which historical events happened. Follow the steps indicated below to make a timeline: Copy the timeline onto a…
-

Interpret. Research budgets for alternative renewable energy sources
EduBook Organización
- 4953 visitas
Look at the graph and do the activities: Which four countries invest the most into researching alternative, renewable energy sources? Which continents are these countries in? Why do you think these…
-

Analyse. R&D programmes
EduBook Organización
- 3891 visitas
Read the text and look at the graph about research and development (R&D) in Spain: Spain has for many years been developing research and development programmes. These programmes often lead to…
-

Interpret. The length of Spain's rivers
EduBook Organización
- 3878 visitas
Study the graph and answer the following questions: Which type of rivers are short with a high flow? Which river that flows into the Atlantic is the longest? And which is the longest that flows into the…
-

Cities as systems: London case study
Maria Pallarés Docente
- 2 lo usan
- 6446 visitas
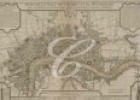
Description of the changes experienced by London during its history. On this web page, we can find a plan of the city and a graph showing the growth of its population between 1891 and 2001 in the…
Te estamos redirigiendo a la ficha del libro...


